Eviction Lab Media Resources
Introduction
Last Updated: January 9, 2024The Eviction Lab is a team of researchers, students, and website architects who believe that a stable, affordable home is central to human flourishing and economic mobility. We provide data and research to promote conversations surrounding evictions and housing.
Members of the media can reach out to us via email at press@evictionlab.org. Please include specific information about your request and your deadline. We will try our best to connect you with the correct source or information.
You can also find all of Eviction Lab’s research here.
The best way to stay up to date on our latest analysis, updates, and eviction reports is to sign up for our newsletter and follow us on social media. To receive our newsletter, please sign up here.


What can reporters do with Eviction Lab’s data and research?
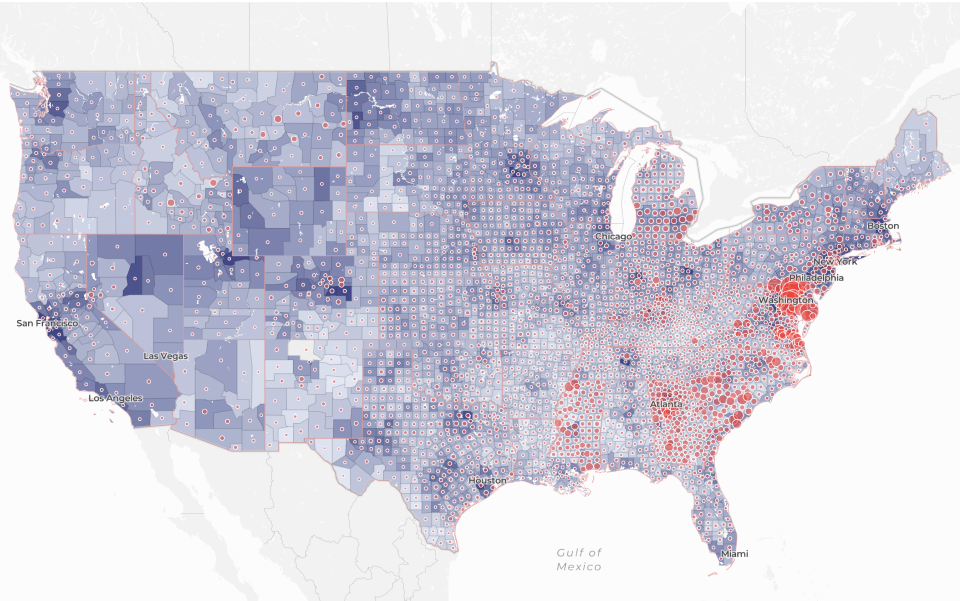
Find eviction rates and overall eviction filings numbers in every county and state between 2000 to 2018
In our National Eviction Map, we have eviction data for the entire country. In some locations, this is based on raw data and it includes numbers sometimes even at the census block level. Where we don’t have raw data, we created modeled estimates, which now allow us to have 18 years of eviction filing estimates for every county and state in the U.S. You can easily compare different locations and create reports. The map also includes demographic data, which provides context to the eviction numbers you see.
All our data is also available to download as CSV files.
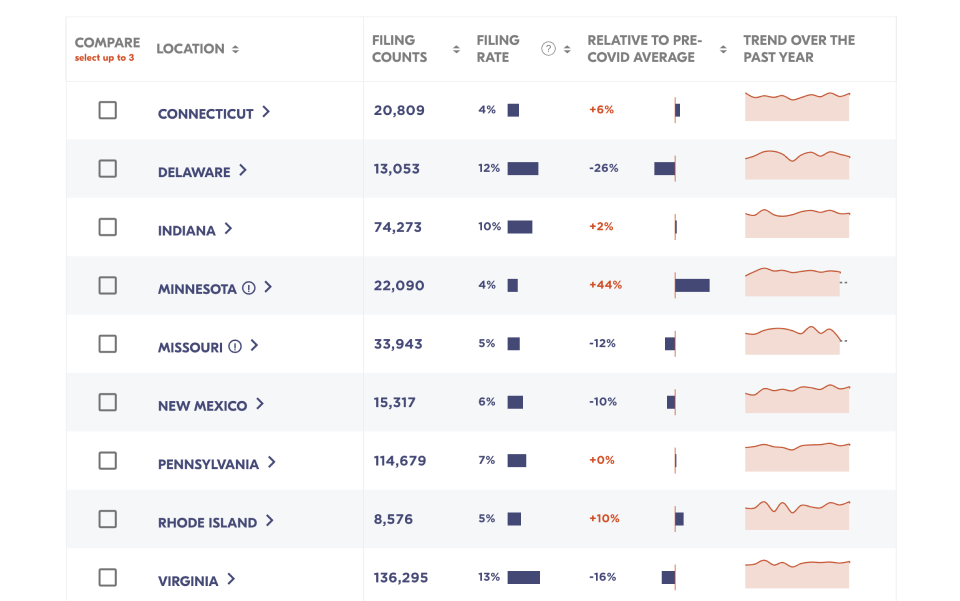
Find eviction filing rates for 34 cities and 10 states (and growing) since the pandemic began
Our tracking system is updated monthly.
At the start of the pandemic, we created the Eviction Tracking System to monitor eviction trends in real time where data is available. Currently, we have information on eviction filings for 34 cities and 10 states. We are always working on updates and adding more data.
In each location, you can find more detailed data including some demographic information, filings per week, geographical distribution, and more (the extent of this data varies depending on the location and the data provided by courts and our partners).
All the data is also available to download as CSV files.
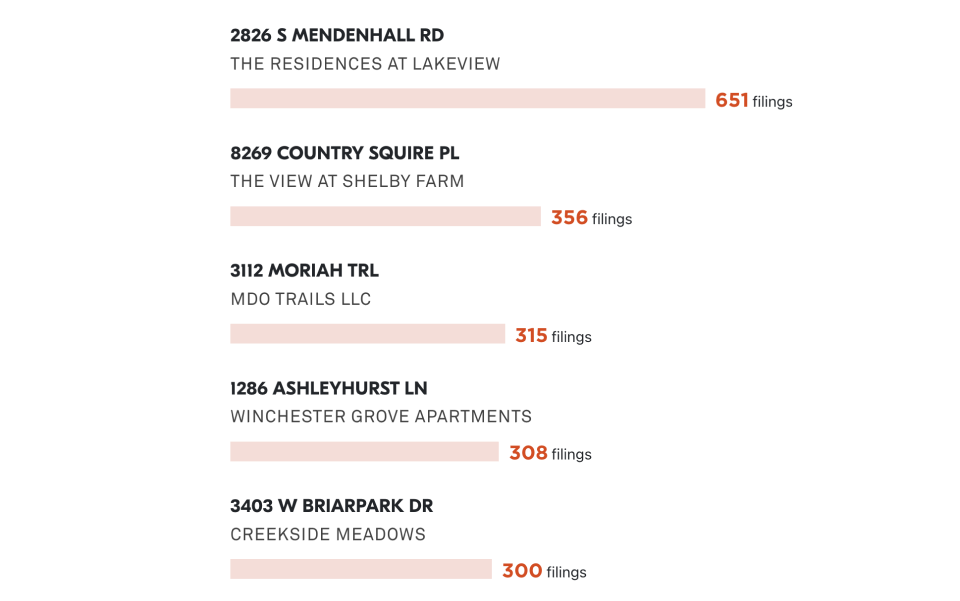
Find the buildings that evict the most tenants in more than 16 locations since the pandemic began
Also as part of our Eviction Tracking System, in select cities, we publish the top 10 buildings that have filed the most evictions since the pandemic began (a list of the top 100 buildings is available for reporters upon request).
Our Eviction Hotspots data is based on the address of the building. It allows reporters to dig deeper and establish behavior patterns among landlords and property owners. In many cities, a big percentage of evictions are carried out by just a few actors. Occasionally, reporters have identified that these actors can also have other negative behaviors like bad tenant service, neglect repairs and overlook unsanitary conditions.
CSV files for reporters are available upon request.
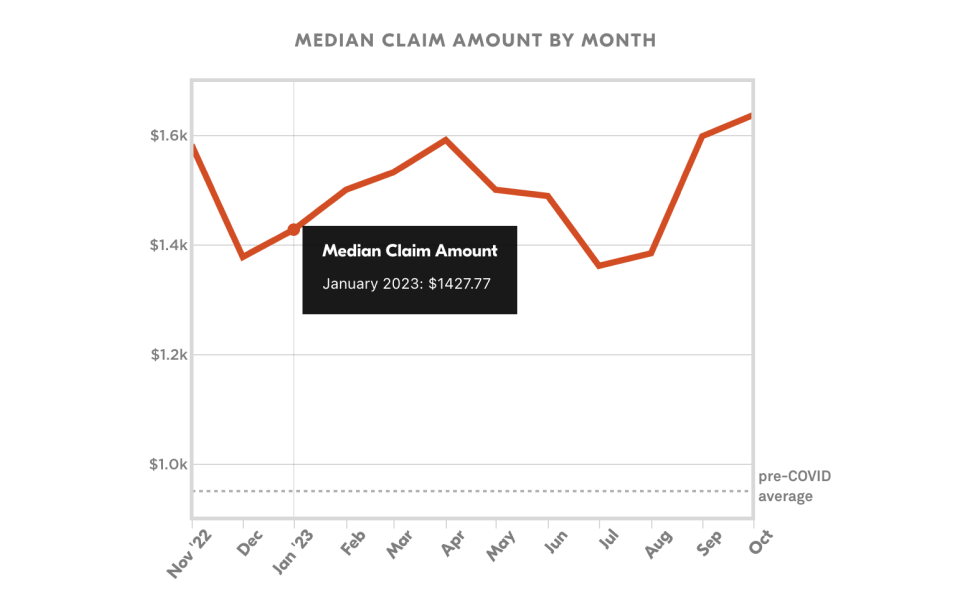
Median claim amounts (debts owed by tenants) since the pandemic began for 5 cities
In specific locations, the data that we capture includes the number of dollars owed by tenants when the landlord files for an eviction. This allows us to create monthly averages that show that tenants who are brought to court owe more money now than prior to the pandemic.
CSV files for reporters are available upon request.
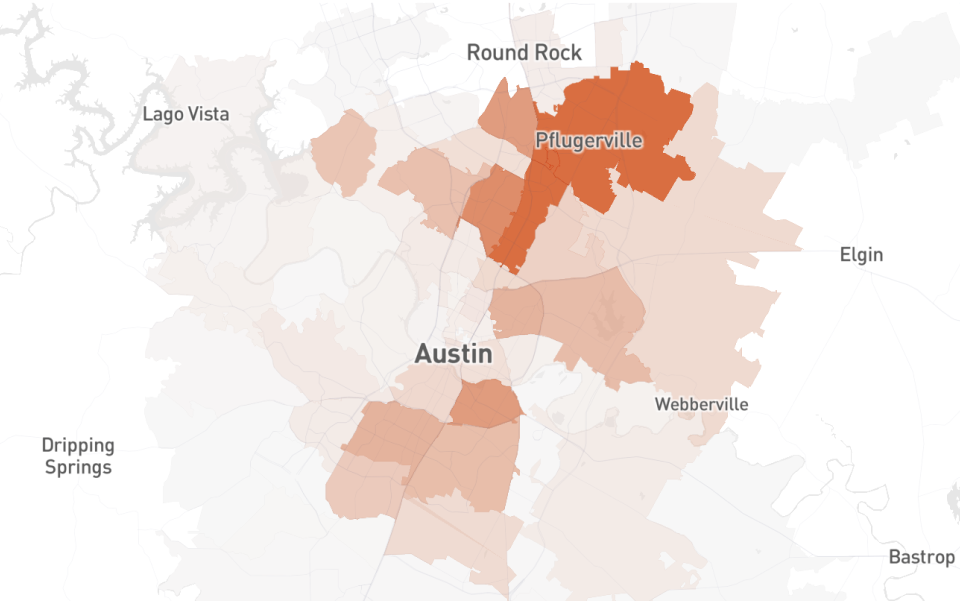
Geographical distribution of eviction filings since the pandemic began for more than 30 locations
In specific locations, the data we have includes addresses or zip codes. This allows us to create maps that include eviction rates, total number of evictions, and evictions compared to pre-pandemic averages. You can access these maps in our Eviction Tracking System.
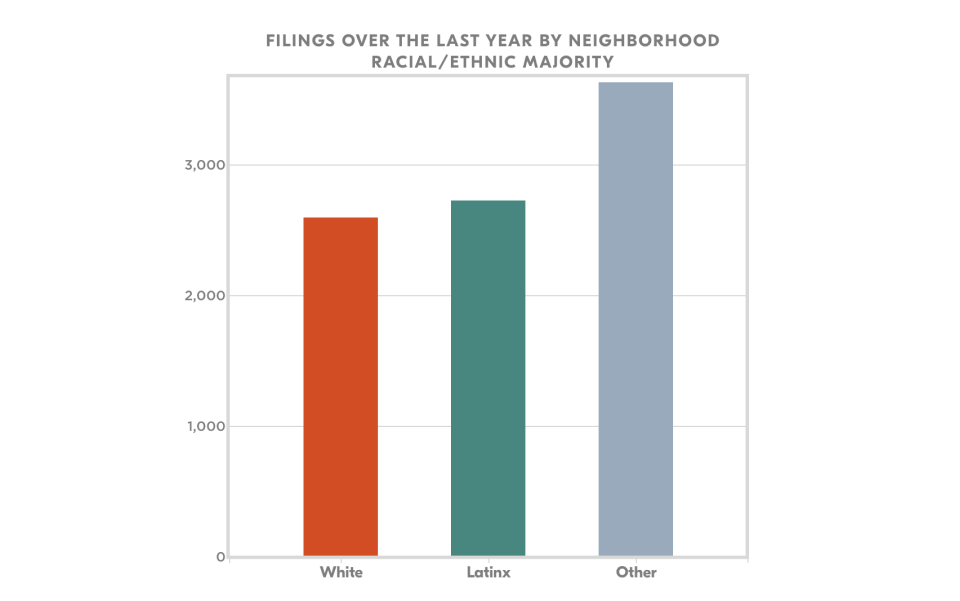
Race/ethnicity breakdown of eviction filings since the pandemic began for 31 cities
In the same locations we have geographical data, we are able to provide an analysis on the impact of evictions on Black and Latinx communities. We provide data in two ways: One is by showing the number of eviction filings in neighborhoods with majority Black and Latinx populations. We also include the number of eviction filings in neighborhoods of white majority and in places where there is no clear majority or another race/ethnicity is the majority (labeled as “other/none”).
Thanks to imputation methods, we also provide estimates of demographic characteristics of those filed against in the last year to give you a better sense of who is facing evictions in a specific site.

We have also published papers that highlight other specific topics, all of which are free to everyone
Our researchers are also available for interviews to explain their findings. You can find all of our research here. Some of these topics include:
- The demographic of evictions: how evictions disproportionately impact children. Includes data about gender, age and race/ethnicity.
- The complex role of gentrification in the eviction crisis.
- How some public housing authorities evict tenants at higher rates than private landlords.
- How low eviction fees charged by courts are promoting higher rates of evictions.
- How evictions impact the suburbs where sometimes tenants are experiencing similar or higher levels of evictions than in cities while having fewer protections and support.
- How evictions negatively impact political participation and voting.
- How state eviction prevention policies impacted housing challenges during the COVID-19 pandemic.
- How the top evicting landlords drive the eviction crisis in the United States.
- The relationship between eviction filings and early COVID-19 vaccination rates.
- Racial and gender disparities in evictions.
- How landlords use courts and eviction filings as a way to collect rent.
Frequently Asked Questions
What’s the proper way to cite your data?

While our researchers have been able to create the most comprehensive picture of the eviction crisis across the country, eviction data is still hard to come by. Explaining and properly citing this data is also difficult and there might be limitations and caveats that media should consider. Here are some ways our data can be misinterpreted alongside the proper way to interpret it.
Example #1
False: "According to the Eviction Lab, landlords in Virginia have filed the most evictions this year across the country."
True: "Out of the 10 states tracked by the Eviction Lab, Virginia has the highest eviction filing count in the last year."
While we don't encourage comparisons using our Eviction Tracking System since we don't track all 50 states quite yet, it is important to clarify to your audience the scope of our data. We do have historical data for all 50 states between 2000-2018. If you have doubts about comparisons between cities, counties or states, feel free to email us at press@evictionlab.org.
Example #2
False: "More than 130,000 tenants were evicted in Virginia in the last year."
True: "More than 130,000 evictions were filed in Virginia in the last year, according to the Eviction Lab."
An eviction has many steps and it's important to clarify which one you are referring to when citing a number. An eviction filing is the result of a landlord filing a case in court to have a tenant removed from a property. A filing is the first step in a court ordered eviction and is not representative of who is actually evicted as many tenants find a solution or leave before a judgment is decided on. While an important metric to fully understanding the eviction crisis, data availability for eviction judgments is lower. Therefore we are not able to offer estimates of eviction judgments in our Eviction Tracking System. However, we do have historical estimates in our National Eviction Map, between 2000 and 2018.
If you have any questions on how to cite any of our research, we are always happy to help. Email us your questions at email us at press@evictionlab.org.
What kind of stories can I write?
Eviction Lab’s data and research allows reporters to write different kinds of stories. Some of those include:
- National and local eviction trends using the National Eviction Map and the Eviction Tracking System.
- Explore behaviors and patterns among specific landlords using our top evictors list (available for selected cities in the Eviction Tracking System.)
- Provide context for stories on specific tenants. Through our data, you can learn more about the impact of evictions in neighborhoods in particular cities, trends on money owed, and how race and ethnicity play a factor in this crisis.
- Explore the effect of evictions among Black and Latinx communities using the Eviction Tracking System and other research.
- And many more. Stay updated with our latest research through our newsletter and our social media.
How can I find eviction and housing stories?
- We strongly recommend reporters go to court where they will find tenants, landlords, lawyers and judges — all of whom are key actors in any eviction story.
- Check our maps (both the National Eviction Map and the Eviction Tracking System) to see which neighborhoods evictions are more likely to happen and where you could knock on doors.
- Advocacy groups are another great point of contact to find tenants that have experienced evictions. On our sister sites, JustShelter.org and EndPovertyUSA.org, you can find a list of housing, community and legal aid organizations that might be a good starting point to find stories.
How can I report on these issues ethically and in a non-extractive manner?
Losing your housing is one of the most vulnerable moments of a person’s life. Your presence can add pain to an already traumatic moment. While in some circumstances drive-throughs with law enforcement executing an eviction might be necessary for your reporting, there are other options to avoid adding to the tension that already exists.
- Consider alternatives previously mentioned when accessing tenants and their stories: go to court hearings, talk to neighbors in the areas that are particularly affected by evictions, and contact community organizations on JustShelter.org (you can also visit https://endpovertyusa.org/ for more organizations).
- The Guide to Reporting Homelessness offers several recommendations that also apply to reporting on evictions. We highly recommend following these.
- Landlords who look to retaliate are a real problem and it is important to offer anonymity in certain cases. We recommend checking this guide on anonymity while interviewing immigrants, which has lessons that also apply to evictions.
- Please be mindful of the shame this topic can sometimes carry for tenants. It is important, both when you approach a tenant and ask them questions, that you don't make a source feel like they did something wrong. Let the tenant guide the story and be in control of their narrative.
- Although you might not be a housing expert, most times you will understand the issue better than the tenants affected and will have connections that might be useful to them. Have resources for tenants, even if these are just a list of organizations. Ask your other sources if they are available to help and what is the best way for people to connect with them. A good starting point is JustShelter.org.
How can I ask local officials for data for my own city or state?
Eviction Lab might not have the data that you need for your story, but we have some advice on how to ask for this data from your local or state courts. As in any FOIA or open records request, we recommend the following:
- Be clear and specific. Brevity is not mandatory or even always useful, as this article explains. You shouldn’t ask for the number of evictions in a county: evictions are a 5-step process and courts can have data points for every step in this process: eviction filings, eviction hearings, eviction judgments, writs of possession, etc. You also should be precise in terms of the period of time and the level of depth of your request (total numbers, individual cases, if you need names of the tenants, landlords, addresses, judges involved, etc.). Also, don’t forget to include what kind of format you’d like this information in (CSV, spreadsheet, word document, pdf, etc.)
- Know exactly what you want. Learn about the different steps of the eviction process, the terminology in your state, and the agencies or courts involved. The definitions of the different steps of an eviction process vary from state to state and using the right terms can save you and the public information officer a lot of time. Eviction filings might also be called "forcible entry and detainers" or "unlawful detainers." The responsible agencies could vary too. You can contact a local housing attorney or a housing advocate to check that your request is appropriate.
- Follow up with the corresponding public information officer and work with them to refine your request. If you have questions about the process and what your rights and possibilities are, including how to appeal certain parts of the process if you are hitting a wall, check this guide by the Reporters Committee for the Freedom of the Press. It includes detailed information for each state and contact information of experts that might be able to guide you through any challenge. To help with requests to officials, we have developed the Eviction Records Letter Generator below.
Eviction Records Letter Generator
If Eviction Lab doesn't have the data you are looking for, and you are interested in accessing data for eviction filings or judgments, use the letter generator below to create your own personalized request to send to your local government. We hope this serves as a guide for you to request data from relevant officials in your area.
Feel free to fill in your information, download your custom letter and add any other touches that would cater to your needs in making a request for data. You can use this resource as much as you’d like.
Note: No data inputted into the letter generator will ever be saved by the Eviction Lab.